Interface
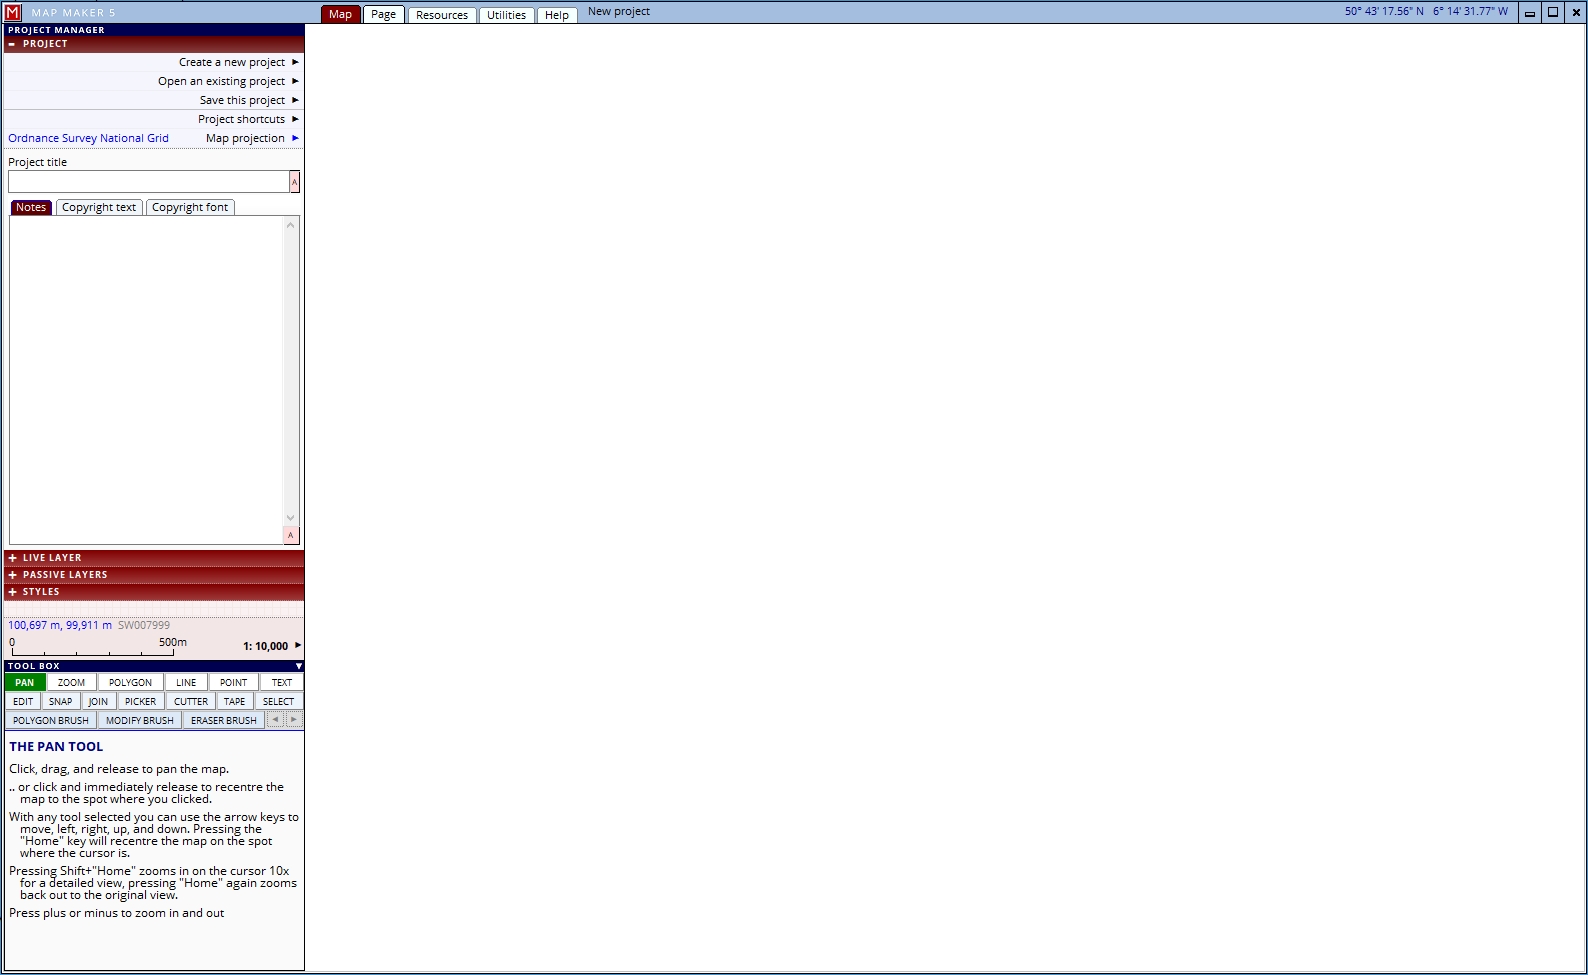
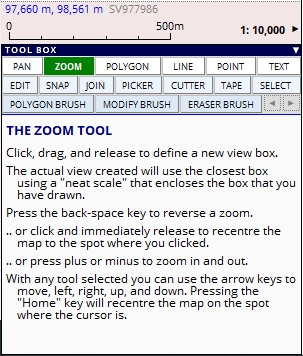
In the interface, Map Maker avoids icons — which require you to remember what they do — so all tools and options are written out instead. Options and menus are hidden from view until they are relevant making it a clean and tidy interface. The panel in the left bottom corner is used to explain the tool at hand.
Base maps
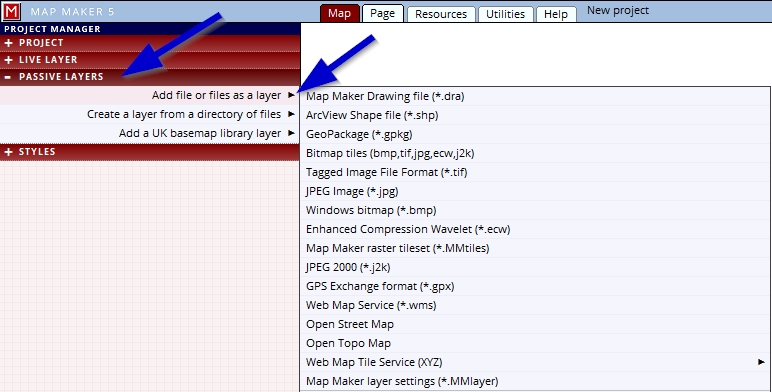
Map Maker allows you to access a range of open source base map layers like Open Street Map or Google Earth aerial photography. Some are presented through a direct 'Add layer' button (like Open Street Map data or OS basemap data), others (like Google Aerial photography) require some setting up.
Map Maker can import data in a variety of common formats, such as scanned images in TIF, JPG, BMP, and ECW formats, and vector data such as DXF, TAB, GML, KML, OSM, GPX, GeoPackage and others.
Map Maker can work directly with ArcGIS Shape files (*.SHP) without the need to convert things.
Layers
In Map Maker a map is made up of layers. Each layer consists of one or more files. For instance you might have half a dozen TIF files to make up a layer to act as a single base map layer. There can be any number of layers. Each layer can be made to show or be 'hidden'. The sequence of the layers in a stack can be changed by dragging the layer up or down in the interface.
The live layer
On top of all the "passive" layers there is an additional layer known as the "live layer". This is where new "objects" are drawn, objects being polygons, lines, points, and text. By clicking on the little triangle in the layer bar one can access the 'layer properties': a host of other settings can be tuned in there.
The live layer is also where the geometry (the shape) of existing objects can be edited and where objects can be deleted.
Passive layers
A passive layer can be a raster layer (often used as a base layer) or a 'vector' ('Object') layer. The latter are often imported layers or layers drawn previously. One can 'copy this layer into the live layer' so that this layer disappears out of the passive layer list and opens in the top 'live layer' ready to be updated. Note that it makes a 'copy of' the passive layer, which means the original will always be safely on file (unless you save the live layer again with the same name). Once a live layer is saved it becomes a passive layer.
Project
Once you have one or two layers on screen, you can save this package of layers, this 'map', as a 'Project'. The project will save all additional settings and information, it is essentially a 'shopping list' so that the software knows which layers to show in which sequence and with what settings. All separate components which make up this one map, this 'project' (layers, styles, page layout, database) can be accessed in other projects.
Attribute data
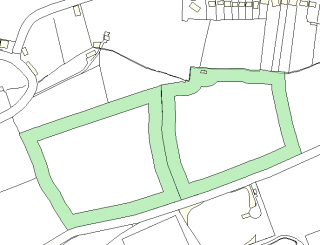
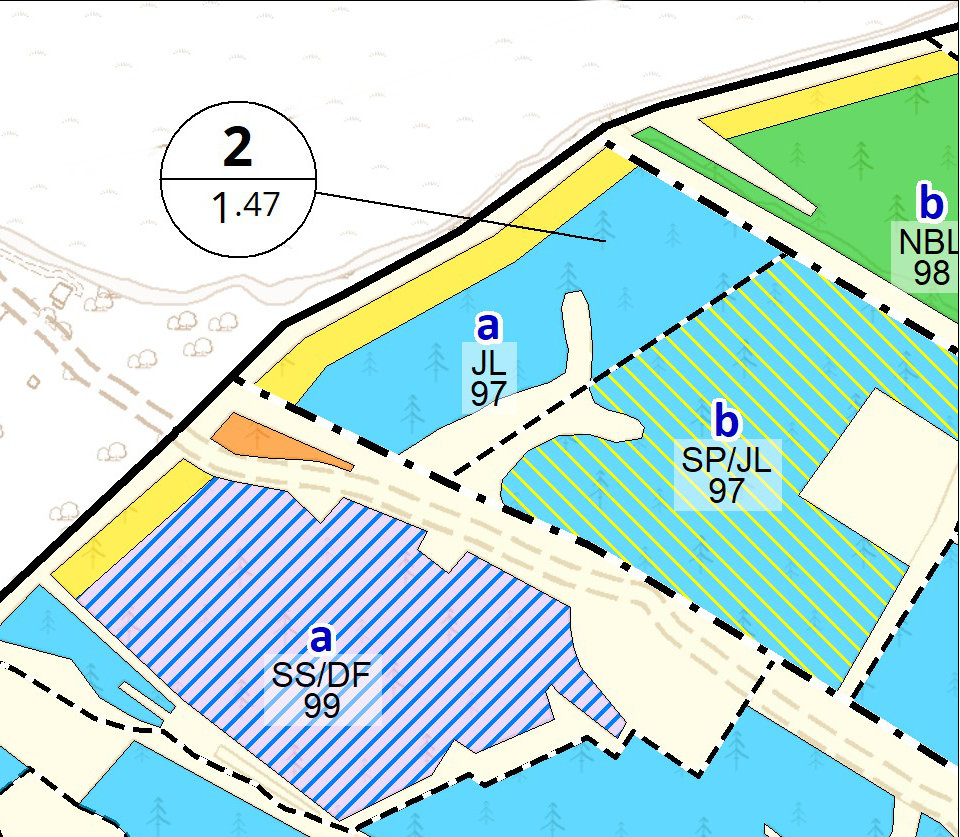
Vector objects (polygons, line, points, and text) are stored in Map Maker Drawing files (*.DRA). Each object can have "attribute data" associated with it. Attribute data is any kind of non-spatial data such as text and numbers. This data can be stored as part of the DRA file or in an external database or spreadsheet such as Excel, DBF files, and CSV files. A layer can be linked to such a database and can display any information kept in that database on the map as a label, or it can take its colour code from that spreadsheet. In for example forestry terms: one can show the Species abbreviation, compartment number and sub letter and plant year. The colour can be governed by that same spreadsheet.
In addition, polygons, lines, and points can be hyper-linked to files, anything from a PDF document to a video file. Then by clicking on the map the user has instant access to all sorts of documentation which is relevant to that object (e.g. a field polygon, or a polygon outlining a house)
Styles
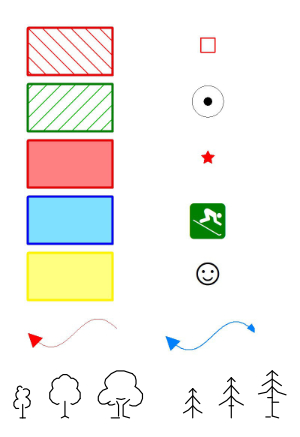
The appearance of an object, such as a polygon, on the screen or the printed page depends on two things: its geometry (i.e. its shape) and the "style" used to render the object. A "style" is a bundle of graphic specifications such as line thickness and colour, fill pattern, the font for any caption, etc., which taken together determine how an object drawn with that style will appear. Each style has an identification number and is stored as part of a style set. Each object has a "style number" associated with it and that number is used to select the corresponding style from the style set. If need be, the "style number" can be determined by some attribute data value so that the style used (and thus the appearance) will be governed by the data values associated with the object. For example, if your data table specified that a given polygon was planted with oak trees then the polygon would be drawn with a corresponding style, but if the data was changed to specify Beech trees then a different style would be selected.
Latitude and longitude data
Each map has a "projection" associated with it. A projection specifies how latitude and longitude coordinates in degrees are converted into X and Y ordinates in metres on a square grid.
If you use data from a GPS device then this data will be in raw latitude and longitude coordinates. If added as a layer then this will be displayed using the projection system for the map. The default projection is set to the UK national grid. Specific projection systems can be defined, alternatively a projection system can be chosen using its international EPSG code.
Utilities
Map Maker contains a number of utility functions. These include importing and exporting vector data and calibrating (also known as 'geo-referencing') bitmap images (such as scanned old paper maps).
In this section, a range of other tools can be found to speed up specific tasks; it is a toolbox not to be under-estimated.
Page layout and printing
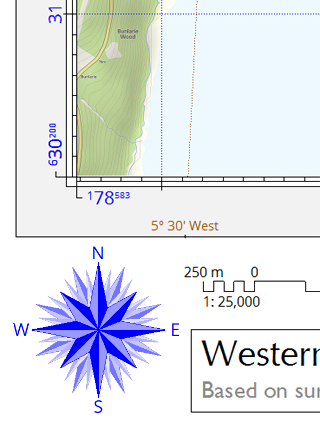
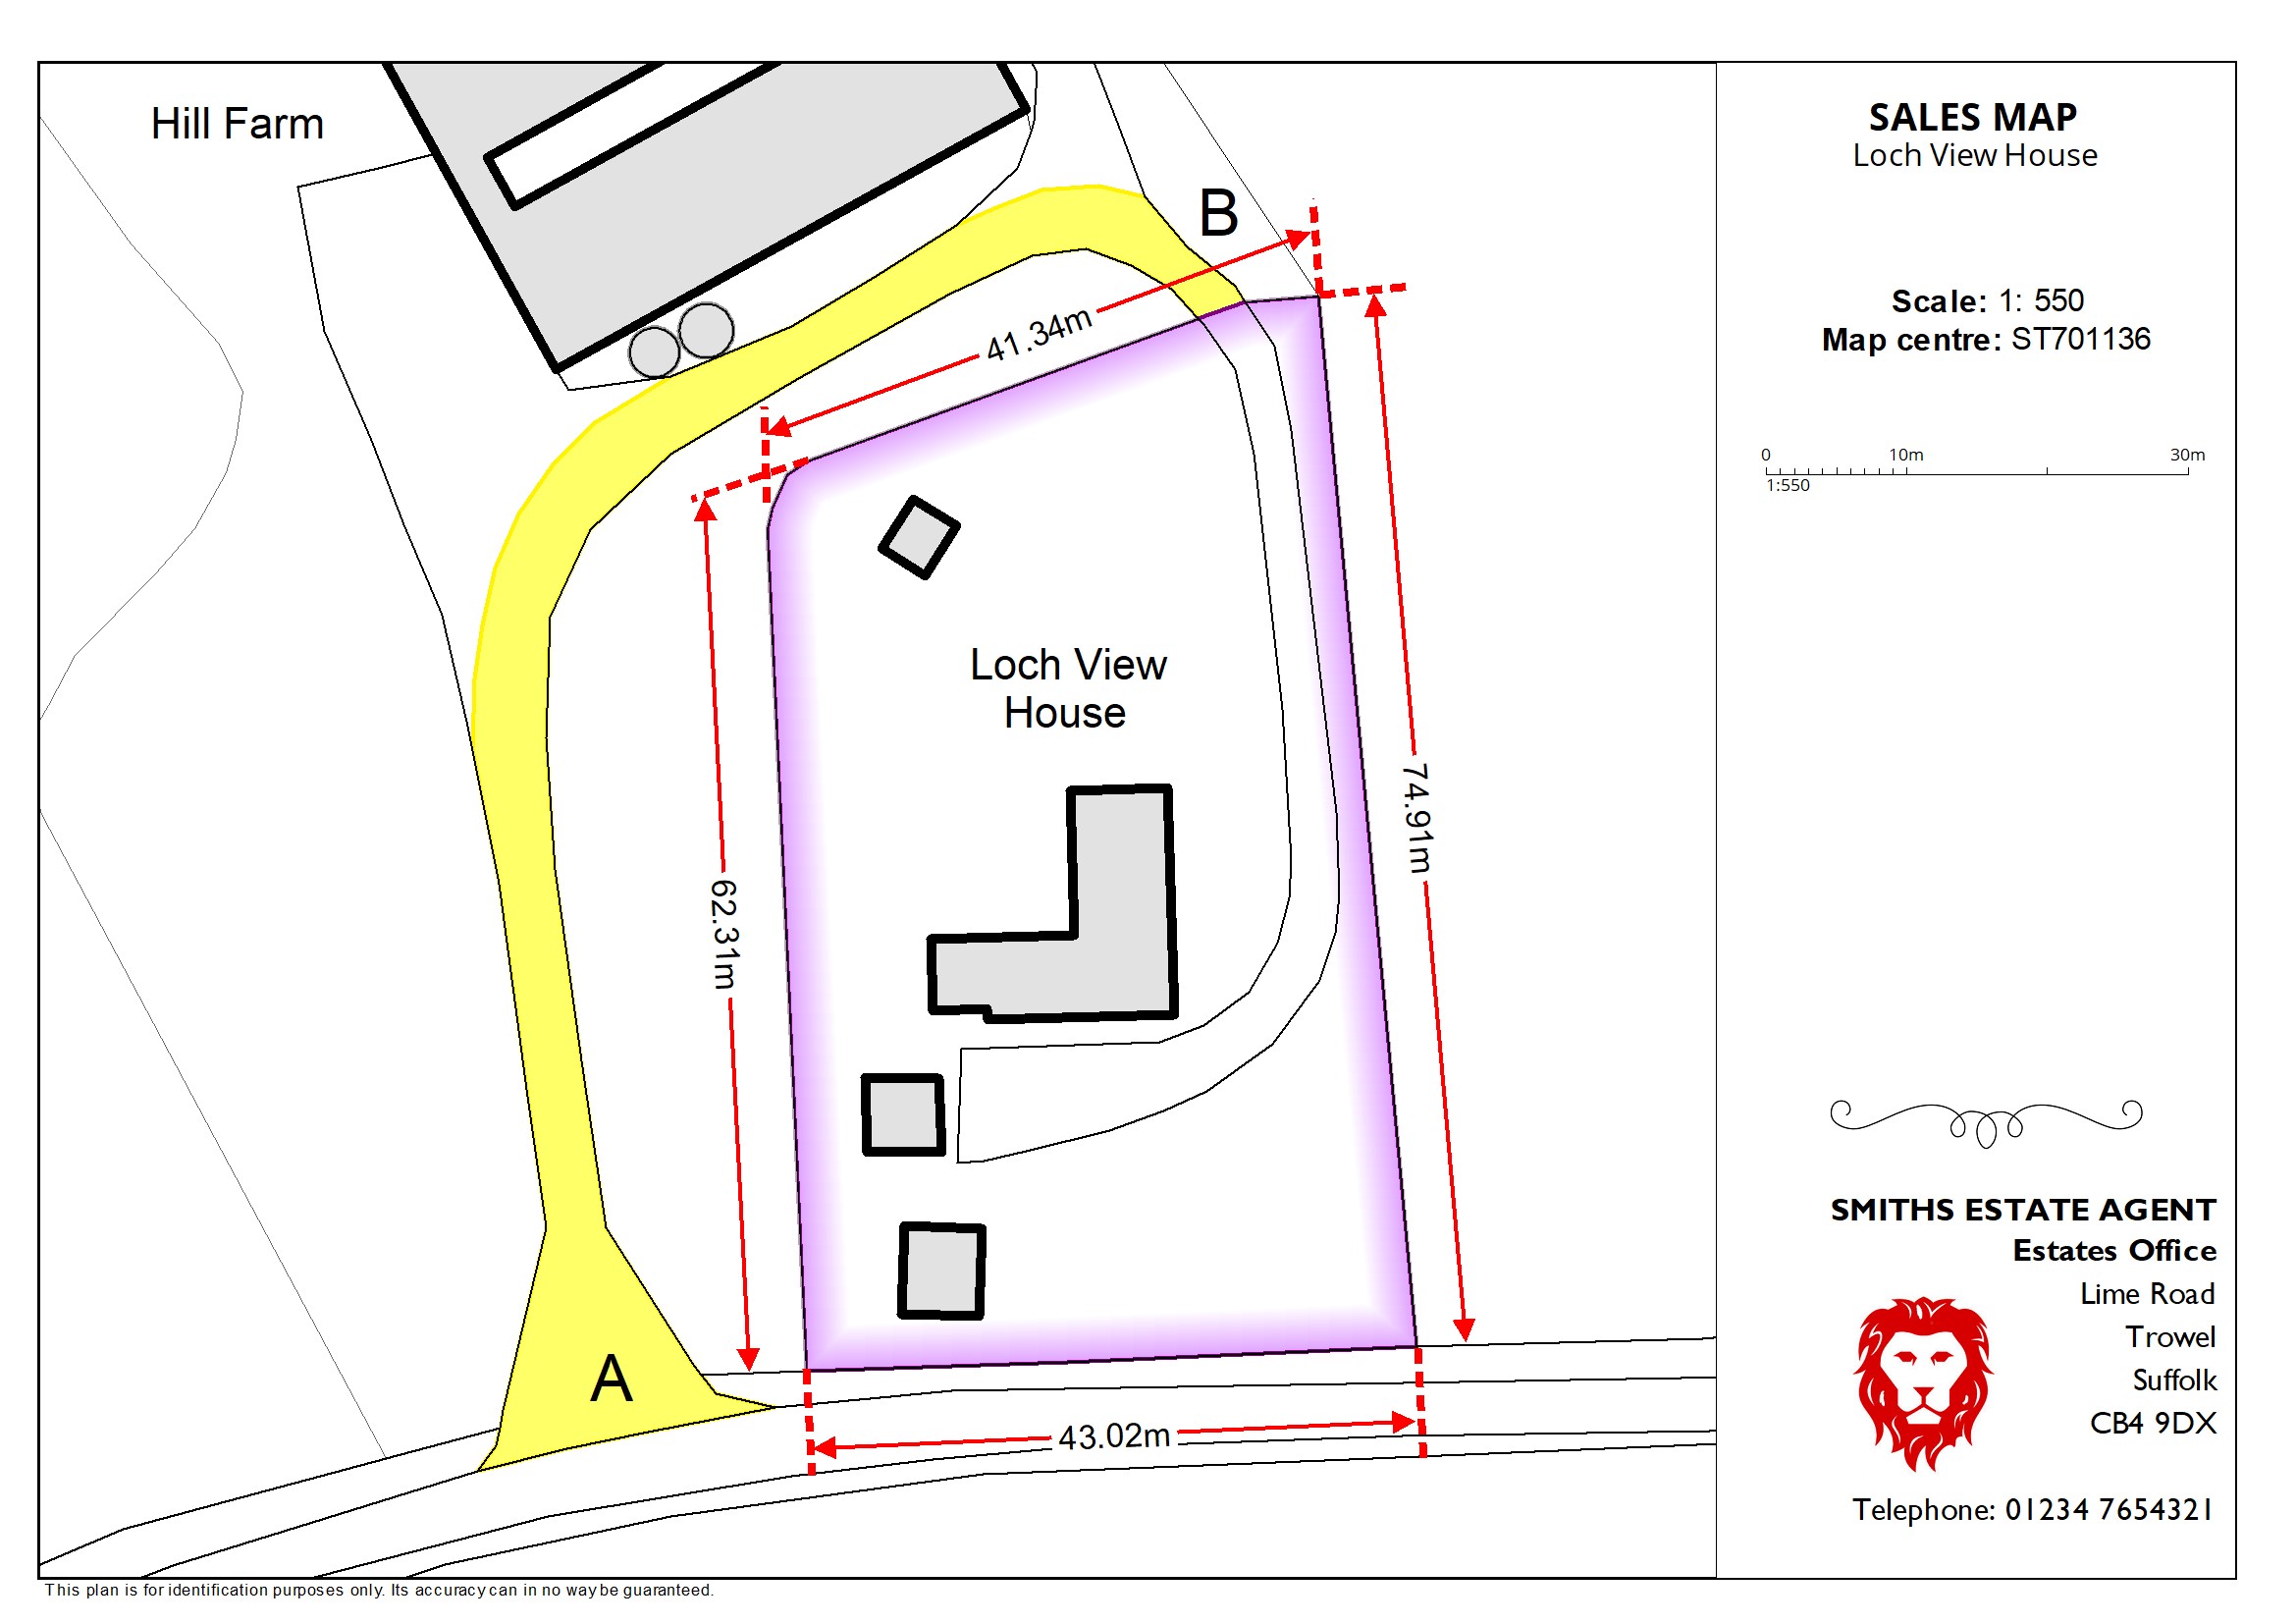
In Map Maker you have a choice of two views: "Map" and "Page". The "Map" view is the one that you will mostly be using when creating or interrogating the map. In the "Page" view you can specify the page size and orientation and add additional "map furniture" such as north points, title panels, scale bars, and the like. The scale of the map and its position within its "frame" can be adjusted in the page view.
The "Page" view allows you to determine how the map will look on the printed page. You can decide to send the map, the page, to the printer or save it as a PDF or JPG, ready to be e-mailed.