xx
xx
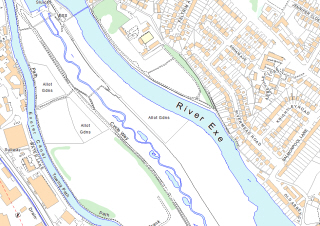
Map Maker is designed to allow a novice user to make professional looking maps while also allowing more advanced users to take advantage of powerful functions. Map Maker is not an atlas - that is to say unlike Google Earth, for instance, it does not come with built-in maps. It is more like a word processor where you, the user, starts with a blank sheet. That said, you can create base maps for your data in a variety of simple ways, such as by buying ready-made digital base maps, scanning your own paper maps, using aerial photography, or using public domain on-line data. Map Maker can import data in a variety of common formats, such as scanned images in TIF, JPG, BMP, and ECW formats, and vector data as Shape files (*.SHP), DXF, TAB, GML, KML, OSM, GPX, GeoPackage, and others.
If you use data from a GPS device then this data will be in raw latitude and longitude coordinates. If added as a layer then this will be displayed using the projection system for the map. For UK users Map Maker, unlike some GIS software, uses the highly accurate OSTN15 system for translating between Latitude and Longitude and the National Grid.
If you require training in Map Maker or help with setting up a complex mapping system using Map Maker then contact Latitude Cartography at info@latitudecartography.co.uk
Layers
In Map Maker a map is made up of layers. Each layer consists of one or more files. For instance you might have half a dozen TIF files to make up a layer to act as a base map. There can be any number of layers.The live layer
On top of all the "passive" layers there is an additional layer known as the "live layer". This is where new "objects" are drawn, objects being polygons, lines, points, and text. The live layer is also where the geometry (the shape) of existing objects can be edited and where objects can be deleted.Attribute data
In Map Maker vector objects (polygons, line, points, and text) are stored in Map Maker Drawing files (*.DRA). Each object can have "attribute data" associated with it. Attribute data is any kind of non-spatial data such as text and numbers. This data can be stored as part of the DRA file or in an external database or spreadsheet such as Excel, DBF files, and CSV files. In addition, polygons, lines, and points can be linked to files, anything from a PDF document to a video file.Styles
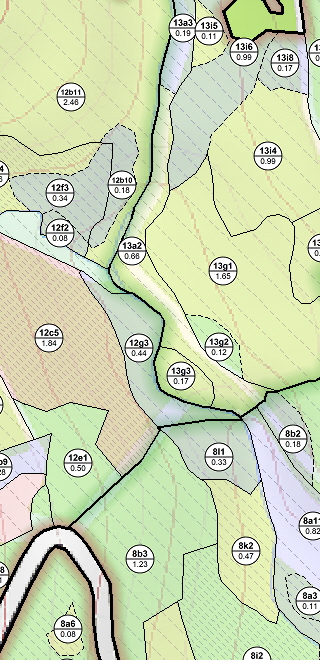
The appearance of an object , such as a polygon, on the screen or the printed page depends on two things: its geometry (i.e. its shape) and the "style" used to render the object. A "style" is a bundle of graphic specifications such as line thickness and colour, fill pattern, the font for any caption etc which taken together determine how an object drawn with that style will appear. Each style has an identification number and is stored as part of a style set. Each object has a "style number" associated with it and that number is used to select the corresponding style from the style set. If need be, the "style number" can be determined by some attribute data value so that the style used (and thus the appearance) will be governed by the data values associated with the object. For example, if your data table specified that a given polygon was planted with oak trees then the polygon would be drawn with a corresponding style, but if the data was changed to specify Beech trees then a different style would be selected.Page layout and printing
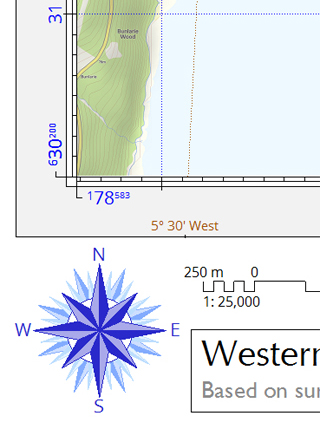
In Map Maker you have a choice of two views: "Map" and "Page". The "Map" view is the one that you will mostly be using when creating or interrogating the map. The "Page" view allows you to determine how the map will look on the printed page (or as an exported bitmap image or PDF file). In the "Page" view you can specify the page size and orientation and add additional "map furniture" such as north points, title panels, scale bars, and the like. The scale of the map and its position within its "frame" can be adjusted in the page view.Latitude and longitude data
Each map has a "projection" associated with it. A projection specifies how latitude and longitude coordinates in degrees are converted into X and Y ordinates in metres on a square grid.If you use data from a GPS device then this data will be in raw latitude and longitude coordinates. If added as a layer then this will be displayed using the projection system for the map. For UK users Map Maker, unlike some GIS software, uses the highly accurate OSTN15 system for translating between Latitude and Longitude and the National Grid.
Utilities
Map Maker contains a number of utility functions. These include importing and exporting vector data and calibrating bitmap images.Map Maker Professional and Map Maker Gratis
The Map Maker Professional edition and "Map Maker Gratis" are one and the same program, but when being used as "Gratis" some of the more advanced features are disabled. When you first download Map Maker it will operate in its full "Professional" configuration. After 30 days, unless a licence has been purchased and entered, the program will switch to the "Gratis" mode. You can go on using the "Gratis" version indefinitely for free.If you require training in Map Maker or help with setting up a complex mapping system using Map Maker then contact Latitude Cartography at info@latitudecartography.co.uk